
 Power BI Sample report – Sales & Returns 2019
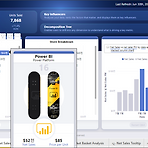
Power BI Sample report – Sales & Returns 2019 아래 링크에서 Sales & Returns Sample 보고서를 확인할 수 있습니다. https://powerbi.microsoft.com/ko-kr/blog/take_a_tour_of_the_new_sales_returns_sample_report/ 책갈피, 선택, 도구 설명 페이지를 사용하였으며, 주요영향요인, 분해 트리, Mapbox, Simple Image, Image, Cluster Map 시각적 개체를 활용하였고 단추의 작업 속성으로 구성한 보고서입니다. 책갈피와 선택(숨기기, 표시)으로 고생한 흔적이 보입니다. 보고서 작성 시 참고하기에 아주 훌륭한 보고서입니다~
Microsoft Faric/Power BI
2019. 12. 18. 08:00
공지사항
최근에 올라온 글
최근에 달린 댓글
- Total
- Today
- Yesterday
링크
TAG
- Power BI Copilot
- 클라우드
- Visual Studio 2010
- 목표
- Microsoft Fabric
- 업데이트
- Cloud
- Windows Azure Mobile Services
- SharePoint 2013
- Power BI Desktop 업데이트
- sharepoint
- SharePoint Online
- Power BI Desktop
- Power BI
- Power BI Update
- Windows Phone 7
- sql server 2012
- copilot
- SharePoint 2010
- 페이지를 매긴 보고서
- SharePoint Object Model
- SQL Azure
- Windows Azure
- Power BI 업데이트
- Power BI Desktop Update
- 정홍주
- Windows Azure 업데이트
- hongju
- redJu
- Paginated Report
| 일 | 월 | 화 | 수 | 목 | 금 | 토 |
|---|---|---|---|---|---|---|
| 1 | 2 | 3 | 4 | 5 | ||
| 6 | 7 | 8 | 9 | 10 | 11 | 12 |
| 13 | 14 | 15 | 16 | 17 | 18 | 19 |
| 20 | 21 | 22 | 23 | 24 | 25 | 26 |
| 27 | 28 | 29 | 30 |
글 보관함